XLSTAT: Forget those tedious, manual statistical calculations! This powerful add-in for Microsoft Excel makes crunching numbers a breeze. Whether you’re a stats whiz or just need to analyze some data for your latest project, XLSTAT offers a user-friendly interface packed with robust tools. From basic descriptive statistics to advanced techniques like PCA and ANOVA, it’s got you covered. Think of it as your all-in-one statistical toolbox, ready to tackle any data challenge you throw its way.
Table of Contents
This guide will walk you through XLSTAT’s key features, showing you how to import data, perform various analyses, create compelling visualizations, and even troubleshoot any hiccups along the way. We’ll explore its applications across different fields, from market research to pharmaceutical studies, and peek into its future development. Get ready to unlock the power of data analysis – XLSTAT style!
XLSTAT’s Core Functionality
XLSTAT is a powerful statistical add-in for Microsoft Excel, offering a wide range of tools for data analysis. It bridges the gap between the familiar Excel interface and the complex world of statistical modeling, making advanced techniques accessible to a broader audience. Its core functionality encompasses descriptive statistics, hypothesis testing, regression analysis, and much more, catering to diverse research and business needs.XLSTAT’s primary statistical functions cover a broad spectrum of analytical techniques.
For example, descriptive statistics allow users to summarize and visualize data using measures like mean, median, standard deviation, and histograms. Hypothesis testing enables users to draw inferences about populations based on sample data, using tests like t-tests, ANOVA, and chi-square tests. Regression analysis allows users to model the relationship between a dependent variable and one or more independent variables, facilitating prediction and understanding of causal relationships.
Beyond these basics, XLSTAT offers advanced capabilities in areas like multivariate analysis (principal component analysis, factor analysis), time series analysis, and machine learning algorithms. These tools find applications in various fields, from market research and finance to healthcare and engineering. For instance, a market researcher might use XLSTAT to perform cluster analysis to segment customers based on their purchasing behavior, while a healthcare professional might employ survival analysis to study the effectiveness of a new treatment.
Basic vs. Advanced Features in XLSTAT
XLSTAT’s basic features typically include the essential statistical functions necessary for most common data analyses. This includes descriptive statistics, basic hypothesis testing (t-tests, ANOVA), simple linear regression, and data visualization tools. These are readily accessible and relatively straightforward to use, making them ideal for users with limited statistical expertise. Advanced features, on the other hand, delve into more complex statistical methodologies.
This might involve multivariate analysis techniques, nonlinear regression models, advanced time series analysis (ARIMA modeling, GARCH models), and more sophisticated machine learning algorithms. These features often require a stronger understanding of statistical principles and are more computationally intensive. The difference lies primarily in the complexity of the statistical models employed and the level of statistical knowledge required for effective interpretation of the results.
For example, while a basic linear regression might suffice for simple predictive modeling, an advanced generalized linear model might be necessary to account for non-linear relationships or non-normal data distributions.
Comparison with Similar Software Packages
XLSTAT competes with several other statistical software packages, including SPSS, SAS, R, and Stata. Compared to these, XLSTAT offers the advantage of seamless integration with the familiar Excel environment. This makes it particularly user-friendly for those already comfortable working within Excel. However, packages like SPSS, SAS, and Stata offer a wider range of specialized statistical procedures and often include more advanced graphical capabilities.
R, a free and open-source software, provides unmatched flexibility and a vast library of statistical packages but has a steeper learning curve. The choice of software often depends on the specific needs of the user and their level of statistical expertise. For instance, a researcher requiring specialized econometric techniques might prefer Stata, while a user needing quick and easy data analysis within a familiar Excel environment might opt for XLSTAT.
The key differentiator lies in the balance between ease of use, integration with existing workflows, and the breadth and depth of statistical functionalities offered.
XLSTAT Data Input and Management

Okay, so you’ve got XLSTAT fired up and ready to rock, but first things first: you need to get your data into the program. This might seem straightforward, but XLSTAT handles a bunch of different file types, and knowing how to import your data efficiently is key to a smooth analysis. Let’s dive into how to get your data ready for XLSTAT’s statistical power.XLSTAT’s data import capabilities are pretty robust.
It’s not just about spreadsheets; it’s about getting your data in whatever format it currently lives in, whether that’s a meticulously crafted Excel file or something a little more…rustic.
Data Formats Supported by XLSTAT
XLSTAT supports a wide range of data formats, ensuring compatibility with most data sources. This includes, but isn’t limited to, `.xls`, `.xlsx`, `.csv`, `.txt`, and database connections (like those from SQL servers). This broad compatibility makes it easy to integrate XLSTAT into your existing workflow, no matter where your data originates. The specific formats supported might vary slightly depending on your XLSTAT version, so always check your software’s documentation for the most up-to-date information.
Importing Data into XLSTAT: A Step-by-Step Guide
Importing data is super simple. Let’s say you’re working with an Excel file. First, open XLSTAT. Then, select the appropriate XLSTAT tool you need (e.g., descriptive statistics, regression, etc.). A dialog box will appear.
In that dialog box, you’ll usually find an option to specify the data range or to import a file. Click on that. A file browser will pop up, allowing you to navigate to and select your data file (e.g., your `.xlsx` file). Once selected, click “Open.” XLSTAT will then automatically import the data into its workspace, ready for analysis.
If your data is in a different format, like a `.csv`, the process is essentially the same; XLSTAT will handle the file type automatically in most cases. Remember to double-check that your data is correctly imported and that XLSTAT has recognized your variables correctly.
Data Cleaning and Transformation Tools
Once your data is in XLSTAT, you’re not done yet! Real-world data is often messy. XLSTAT offers a suite of tools to clean and transform your data, making it suitable for analysis. This includes handling missing values (imputation), transforming variables (e.g., standardization, logarithmic transformations), and identifying and removing outliers. For example, if you have missing values in your dataset, XLSTAT allows you to replace them with mean values, median values, or even more sophisticated imputation methods.
Similarly, if you need to standardize your data (e.g., to have a mean of 0 and a standard deviation of 1), XLSTAT provides tools to do this easily. These tools are crucial for ensuring the accuracy and reliability of your statistical analysis. Ignoring data cleaning can lead to skewed results and incorrect conclusions. Think of it like prepping your ingredients before cooking – you wouldn’t start baking a cake without mixing the batter properly, right?
XLSTAT’s Regression Analysis Tools
Okay, so we’ve covered the basics of XLSTAT – getting data in and managing it. Now let’s dive into the really cool stuff: regression analysis. This is where XLSTAT lets you uncover the relationships between different variables in your data, allowing you to make predictions and understand your data on a deeper level. Think of it as detective work for your spreadsheets!
XLSTAT offers a robust suite of regression tools, going far beyond the simple linear regression you might remember from intro stats. We’ll explore how to use some of these tools, and see how they can be applied to real-world problems.
Performing Linear Regression Analysis in XLSTAT
Linear regression is the bread and butter of predictive modeling. In XLSTAT, performing a linear regression is pretty straightforward. First, you’ll select your data – identifying your dependent variable (the one you’re trying to predict) and your independent variables (the ones you think influence the dependent variable). Then, you’ll navigate to the appropriate regression analysis menu within XLSTAT.
The software will guide you through specifying your model, choosing options for diagnostics (like checking for multicollinearity), and selecting the outputs you want to see. Once you run the analysis, XLSTAT will generate a comprehensive report, including the regression equation, coefficients, p-values, R-squared, and various diagnostic plots. These results will tell you how well your model fits the data and the significance of your independent variables.
For example, if you’re trying to predict house prices (dependent variable) based on size and location (independent variables), XLSTAT will give you an equation that allows you to estimate the price based on these factors, along with statistics to tell you how accurate your predictions are likely to be.
Comparison of Regression Models in XLSTAT
XLSTAT doesn’t just limit you to basic linear regression. It provides a range of powerful models to suit different data types and research questions. Choosing the right model depends heavily on the nature of your data and the relationships you expect to find.
| Regression Model | Description | Assumptions | When to Use |
|---|---|---|---|
| Linear Regression | Models a linear relationship between the dependent and independent variables. | Linearity, independence of errors, homoscedasticity, normality of errors. | When a linear relationship is expected between variables. |
| Polynomial Regression | Models a non-linear relationship using polynomial functions of the independent variables. | Similar to linear regression, but linearity assumption is relaxed. | When a non-linear relationship is suspected. |
| Multiple Regression | Models the relationship between a dependent variable and multiple independent variables. | Similar to linear regression, but considers multiple predictors. | When multiple factors influence the dependent variable. |
| Logistic Regression | Predicts the probability of a binary outcome (0 or 1). | Binary dependent variable, independence of errors, linearity of logit. | When predicting a categorical outcome. |
Real-World Applications of Regression Analysis with XLSTAT
Regression analysis isn’t just a theoretical exercise; it’s a powerful tool with widespread applications across various fields.
For instance, in marketing, XLSTAT could be used to model the relationship between advertising spending (independent variable) and sales (dependent variable). This allows companies to optimize their advertising budgets by predicting the impact of different spending levels. In finance, regression can be used to model the relationship between economic indicators (independent variables) and stock prices (dependent variable), helping investors make informed decisions.
In healthcare, regression could be employed to predict the risk of a disease based on patient characteristics (independent variables) and disease status (dependent variable), aiding in preventative care and treatment planning. Essentially, any situation where you have a dependent variable you want to predict and independent variables you think influence it is a candidate for regression analysis using XLSTAT.
XLSTAT’s ANOVA Capabilities
XLSTAT offers a robust suite of ANOVA (Analysis of Variance) tools, making it a go-to statistical package for researchers and analysts across various fields. ANOVA tests are crucial for comparing means across different groups, helping us determine if observed differences are statistically significant or simply due to random chance. XLSTAT simplifies this process, providing a user-friendly interface and a range of ANOVA types to suit diverse experimental designs.XLSTAT provides several types of ANOVA tests, each designed for specific experimental setups.
Understanding these differences is key to choosing the right test for your data.
Types of ANOVA Tests in XLSTAT
XLSTAT’s ANOVA capabilities encompass a variety of tests, catering to different research questions and data structures. The most common types include one-way ANOVA, two-way ANOVA, and repeated measures ANOVA. One-way ANOVA is used when comparing the means of two or more groups based on a single independent variable. Two-way ANOVA extends this to analyze the effects of two independent variables and their interaction.
Repeated measures ANOVA is applied when the same subjects are measured multiple times under different conditions. Beyond these core types, XLSTAT often includes options for post-hoc tests (like Tukey’s HSD) to further investigate significant differences between specific groups after an ANOVA reveals an overall significant effect. The choice depends heavily on the experimental design.
Designing an Experiment Using XLSTAT’s ANOVA Functions
Let’s imagine a study investigating the effect of different fertilizers (Fertilizer A, Fertilizer B, and a Control group with no fertilizer) on the yield of a particular crop (e.g., tomatoes). We’d randomly assign several tomato plants to each fertilizer group, ensuring each group has a similar number of plants. After a set growing period, we’d measure the yield (in kilograms) of tomatoes from each plant.
This data, organized with columns for “Fertilizer Type” and “Yield,” would then be imported into XLSTAT. We’d select one-way ANOVA because we’re testing the effect of a single factor (fertilizer type) on a continuous outcome variable (yield). XLSTAT would then perform the analysis, providing the F-statistic, p-value, and other relevant statistics to determine if there are significant differences in tomato yield among the fertilizer groups.
Reporting ANOVA Results from XLSTAT
After running the ANOVA in XLSTAT, a well-structured report should clearly communicate the findings. The report should start with a brief description of the study’s objective and methodology. Then, present the ANOVA table, including the degrees of freedom (df), the F-statistic, and the p-value. For instance, a table might look like this:
| Source of Variation | df | SS | MS | F | p-value |
|---|---|---|---|---|---|
| Between Groups (Fertilizer) | 2 | 15.2 | 7.6 | 4.2 | 0.025 |
| Within Groups (Error) | 27 | 48.6 | 1.8 | ||
| Total | 29 | 63.8 |
The report should interpret the p-value. If the p-value (e.g., 0.025 in this example) is less than the significance level (typically 0.05), we reject the null hypothesis and conclude that there is a statistically significant difference in tomato yield among the fertilizer groups. Finally, if significant, post-hoc tests (like Tukey’s HSD, if run in XLSTAT) should be reported to specify which fertilizer groups differ significantly from each other.
A concise summary of these findings, including practical implications, concludes the report.
XLSTAT for Specific Industries
XLSTAT’s statistical capabilities extend far beyond general-purpose analysis; it’s a powerful tool tailored to meet the unique needs of various industries. Its flexibility allows researchers and analysts to tackle complex problems across diverse fields, delivering actionable insights and driving informed decision-making. Let’s delve into some specific examples.
XLSTAT in the Pharmaceutical Industry
In pharmaceutical research and development, rigorous statistical analysis is paramount. XLSTAT plays a crucial role in various stages, from clinical trial design and data analysis to drug efficacy and safety assessments. For instance, XLSTAT’s advanced ANOVA capabilities can help researchers determine if a new drug is significantly more effective than a placebo, while its regression tools can model the relationship between drug dosage and observed effects.
Furthermore, XLSTAT’s ability to handle large datasets and perform complex statistical tests is invaluable in analyzing the vast amount of data generated during clinical trials, enabling researchers to identify significant trends and draw reliable conclusions. This rigorous approach helps to ensure the safety and efficacy of new medications before they reach the market. Imagine analyzing the results of a phase III clinical trial comparing a new cancer treatment to the standard of care; XLSTAT’s survival analysis tools would be critical in determining if the new treatment significantly improves patient survival rates.
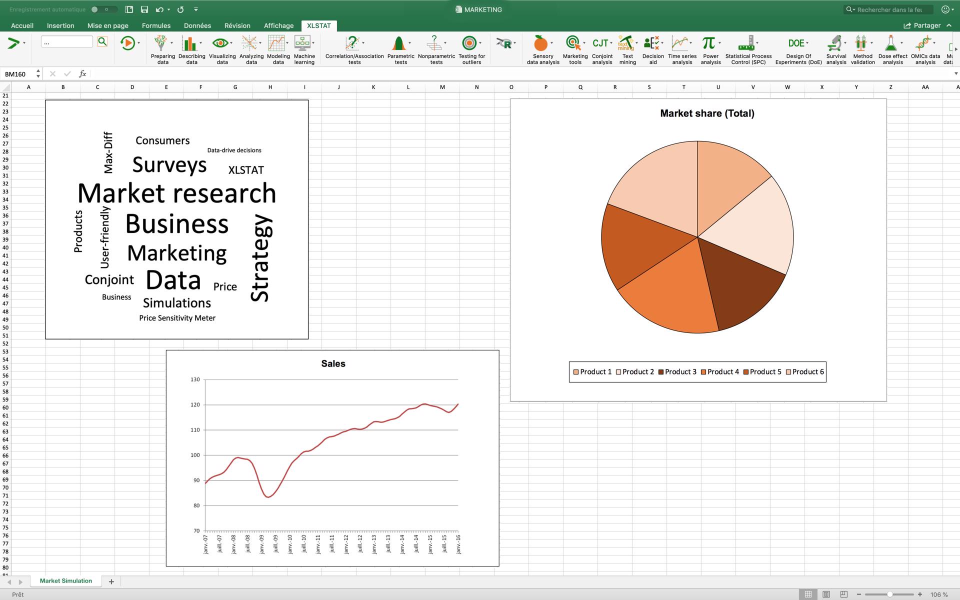
XLSTAT Applications in Market Research
Market research heavily relies on data analysis to understand consumer behavior, predict market trends, and optimize marketing strategies. XLSTAT provides a comprehensive suite of tools for this purpose. For example, XLSTAT’s conjoint analysis can help researchers determine the relative importance of different product attributes to consumers, allowing companies to design products that better meet customer needs. Similarly, cluster analysis can segment customers into distinct groups based on their purchasing behavior and demographics, enabling targeted marketing campaigns.
Consider a company launching a new line of smartphones; XLSTAT’s factor analysis could help identify the key factors influencing consumer purchasing decisions, such as price, features, and brand reputation. This information would then inform pricing strategies, product development, and marketing efforts.
XLSTAT in the Financial Sector
The financial sector relies heavily on data-driven decision making. XLSTAT’s statistical power allows financial analysts to model risk, predict market trends, and optimize investment portfolios. For example, XLSTAT’s time series analysis tools can be used to forecast stock prices or interest rates, while its regression models can assess the relationship between various economic indicators and market performance. Furthermore, XLSTAT can perform risk assessments, helping financial institutions to manage their exposure to various types of risk.
Imagine a bank assessing the creditworthiness of loan applicants; XLSTAT’s logistic regression models could predict the probability of default, allowing the bank to make more informed lending decisions. This predictive capability is crucial for mitigating financial risk and ensuring the stability of the financial system.
XLSTAT’s Advanced Statistical Methods
XLSTAT offers a robust suite of advanced statistical methods beyond the basics, providing powerful tools for data exploration, analysis, and interpretation. These methods are particularly useful for uncovering hidden patterns and relationships within complex datasets, enabling researchers and analysts to draw more nuanced conclusions. This section will delve into some of XLSTAT’s most powerful advanced statistical capabilities, focusing on Principal Component Analysis (PCA), Factor Analysis, and a comparison of Cluster Analysis and Discriminant Analysis.
Principal Component Analysis (PCA) in XLSTAT
XLSTAT’s PCA implementation allows users to reduce the dimensionality of large datasets while retaining most of the original data’s variance. This is achieved by identifying principal components, which are linear combinations of the original variables. These components capture the maximum variance in the data, sequentially. Imagine analyzing customer preferences across dozens of product attributes; PCA can distill this into a few key components representing underlying preferences, simplifying analysis and visualization.
XLSTAT provides detailed outputs including component loadings, scores, and biplots, facilitating interpretation of the reduced dimensional space. For example, a marketing team could use XLSTAT’s PCA to understand which product features are most strongly associated with customer satisfaction, leading to more targeted product development and marketing strategies.
Factor Analysis in XLSTAT
Similar to PCA, Factor Analysis in XLSTAT aims to reduce the number of variables in a dataset. However, Factor Analysis focuses on uncovering latent variables, or factors, that explain the correlations between observed variables. Unlike PCA, which is purely descriptive, Factor Analysis aims to build a theoretical model explaining the underlying structure of the data. Consider a study measuring various aspects of job satisfaction.
Factor Analysis might reveal underlying factors like “work-life balance” and “managerial support” that influence the observed variables (e.g., stress levels, promotion opportunities, etc.). XLSTAT’s implementation allows for various rotation methods (like Varimax or Quartimax) to improve the interpretability of the extracted factors. The output clearly displays factor loadings, enabling researchers to understand the relationship between observed variables and the underlying latent factors.
Cluster Analysis and Discriminant Analysis in XLSTAT: A Comparison
XLSTAT provides tools for both Cluster Analysis and Discriminant Analysis, two distinct but related multivariate techniques. Cluster Analysis is an unsupervised technique used to group similar observations together based on their characteristics. It’s useful when you don’t have pre-defined groups and want to discover natural groupings within the data. For example, a retailer might use cluster analysis to segment customers based on their purchasing behavior, leading to more targeted marketing campaigns.
In contrast, Discriminant Analysis is a supervised technique used to predict group membership based on observed variables. It’s useful when you have pre-defined groups and want to build a model to predict which group a new observation belongs to. For instance, a bank might use discriminant analysis to predict loan defaults based on applicant characteristics (credit score, income, etc.).
While both techniques deal with grouping data, Cluster Analysis explores inherent structure without prior knowledge of groups, whereas Discriminant Analysis builds a predictive model using known group memberships.
XLSTAT’s User Interface and Workflow
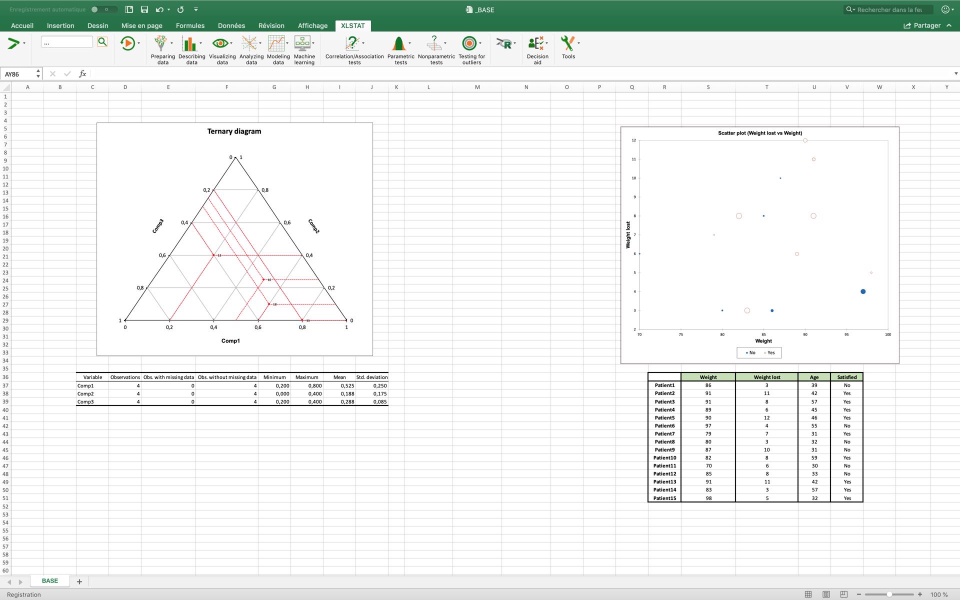
XLSTAT’s interface, while initially appearing somewhat complex, is actually quite intuitive once you get the hang of it. Its ribbon-style menu, similar to Microsoft Office applications, provides easy access to a wide range of statistical tools. Understanding the workflow and key navigation elements is key to unlocking XLSTAT’s full potential. This section will guide you through the process of navigating the interface, creating projects, and utilizing helpful tips and tricks to streamline your workflow.
XLSTAT’s interface is designed around a familiar ribbon structure. The main menu bar at the top provides access to file management, editing tools, and viewing options. Below this, the ribbon displays various toolbars categorized by statistical function. For example, you’ll find toolbars for data analysis, regression, ANOVA, and more. Each toolbar contains a collection of buttons and dropdown menus that allow you to access specific statistical tests and procedures.
The main workspace displays your data, allowing for direct interaction and visualization of results.
Navigating the XLSTAT Interface
The XLSTAT interface is largely self-. The ribbon at the top houses all the available functions, neatly categorized into logical groups. To perform a specific statistical test, locate the relevant section in the ribbon (e.g., “Regression” for regression analysis). Then, select the desired test from the options available within that section. Once selected, a dialog box will appear, prompting you to specify your data range, select options, and define parameters for the analysis.
The results will then be displayed in a new sheet within your Excel workbook, often including tables, charts, and summary statistics.
Creating and Saving XLSTAT Projects
To start a new XLSTAT project, simply open Excel and load your dataset. Then, open XLSTAT and select the desired analysis from the ribbon. This will automatically link XLSTAT to your Excel data. After performing your analysis, XLSTAT will present the results in a new sheet within your Excel file. To save your work, simply save the Excel file as you normally would.
XLSTAT projects are essentially saved as standard Excel files, containing the data, analysis settings, and results. This makes it easy to share and reopen your work later.
Helpful Tips and Tricks for Efficient XLSTAT Use
Efficient use of XLSTAT hinges on understanding its features and workflows. Here are some tips:
Mastering XLSTAT requires practice and familiarity with its functions. Experimenting with different analyses and options is the best way to learn. Start with simpler analyses and gradually progress to more complex procedures. Utilize the built-in help documentation to clarify any doubts or uncertainties. The help files are quite comprehensive and offer step-by-step guides for most of the procedures.
Additionally, XLSTAT’s online community forums are a valuable resource for assistance and troubleshooting.
XLSTAT’s a pretty solid statistical software package, especially if you’re crunching a lot of data for your research papers. Sometimes, though, you need a virtual environment for running it, which is where something like oracle virtualbox comes in handy. Setting up a VM lets you keep your main OS clean while still accessing XLSTAT’s features without any conflicts.
- Utilize XLSTAT’s data import options: XLSTAT supports various data formats, streamlining the process of importing data from external sources.
- Explore the visualization tools: XLSTAT provides various chart and graph options to effectively visualize your results and communicate findings.
- Take advantage of the customization options: Tailor your analyses to meet specific needs by adjusting parameters and settings within the dialog boxes.
- Learn keyboard shortcuts: Keyboard shortcuts can significantly speed up your workflow. Explore the XLSTAT help files to discover time-saving shortcuts.
- Save your analysis settings: Save your preferred settings as templates for future analyses to maintain consistency and efficiency.
Troubleshooting Common XLSTAT Issues
XLSTAT, while a powerful statistical software package, can sometimes throw users for a loop. Understanding common errors and potential limitations is key to maximizing its effectiveness and avoiding frustration. This section provides a troubleshooting guide to address frequently encountered problems and offer practical solutions. We’ll cover common error messages, data input issues, and limitations of certain statistical methods within XLSTAT.
Data Input Errors
Incorrect data input is a frequent source of problems. XLSTAT requires data in a specific format, usually a spreadsheet-like structure. Problems arise from things like incorrect data types (e.g., text in a numerical column), missing values, or inconsistent data formatting. Ensuring your data is clean and properly formatted before importing it into XLSTAT is crucial. For example, if you’re performing a regression analysis and your independent variable column contains text values instead of numbers, XLSTAT will likely produce an error message or inaccurate results.
Check for and correct any inconsistencies before running your analysis.
Error Messages and Their Interpretations
XLSTAT provides error messages to alert users to problems. These messages often pinpoint the source of the issue, such as insufficient data, incompatible data types, or violations of statistical assumptions. For example, a common error message relates to insufficient data for a particular analysis. This means the dataset doesn’t meet the minimum requirements for the chosen statistical test.
Another common error occurs when trying to perform an analysis on data that violates assumptions of the chosen statistical test, like the assumption of normality in ANOVA. Carefully review the error message and the XLSTAT documentation for guidance on resolving the specific problem.
Limitations of Specific Statistical Methods
While XLSTAT offers a wide array of statistical methods, each has its limitations. For instance, certain advanced techniques may require large sample sizes for reliable results. Other methods might be sensitive to outliers or non-normality in the data. Understanding these limitations is essential for interpreting results correctly. For example, a small sample size in a logistic regression might lead to unreliable estimates of the model parameters.
In such cases, consider increasing the sample size if possible, or exploring alternative methods less sensitive to sample size limitations. Consulting the XLSTAT documentation for each specific method will help understand its assumptions and limitations.
Troubleshooting Frequently Asked Questions
Many common questions revolve around data preparation and interpretation of results. Users often ask about handling missing data, the appropriate statistical test for a given research question, or interpreting specific output tables. XLSTAT offers various tools for handling missing data, including imputation methods. Choosing the correct statistical test depends on the research question, the type of data, and the assumptions that can be reasonably met.
Understanding the different output tables and their interpretation requires familiarity with statistical concepts. Referencing the XLSTAT help files and relevant statistical textbooks can greatly assist in addressing these common questions.
Workarounds for XLSTAT Limitations
Sometimes, XLSTAT might not directly support a specific statistical method or analysis needed. In these cases, workarounds might involve preprocessing data outside of XLSTAT, using alternative software, or adapting the analysis to fit within XLSTAT’s capabilities. For instance, if XLSTAT lacks a specific advanced method, you might use R or Python to perform the analysis and then import the results back into XLSTAT for visualization or further processing.
Remember to always carefully document any workarounds used to ensure reproducibility and transparency of your analysis.
XLSTAT’s Integration with Other Software

XLSTAT’s power isn’t just in its statistical capabilities; it’s also in how seamlessly it works with other software, especially within the familiar Excel environment. This integration streamlines your workflow, allowing you to leverage the strengths of both XLSTAT and your existing software ecosystem. This makes complex statistical analysis accessible to a wider range of users, without requiring a steep learning curve or a shift to entirely new software.XLSTAT’s primary strength lies in its tight integration with Microsoft Excel.
This means you don’t have to export data to a separate program, learn a new interface, or struggle with data transfer issues. Instead, XLSTAT operates directly within the Excel environment, using your familiar spreadsheet as both input and output. This integration simplifies the entire process, from data preparation to result interpretation.
XLSTAT’s Integration with Microsoft Excel
XLSTAT functions as an add-in for Microsoft Excel. This means it appears as a ribbon in the Excel interface, readily accessible alongside other Excel tools. Data resides directly in your Excel worksheets, and XLSTAT’s dialog boxes allow you to select the data ranges and parameters for your analysis directly from the spreadsheet. Results are then presented in new worksheets within the same Excel file, making it easy to combine statistical findings with your existing data and visualizations.
This eliminates the need for cumbersome data import/export processes common with standalone statistical software packages. For example, running a regression analysis requires simply selecting the relevant data columns within Excel, and XLSTAT handles the rest, presenting the regression output neatly organized in a new Excel sheet.
XLSTAT’s Compatibility with Other Statistical Software
While Excel is XLSTAT’s primary integration point, results can be exported in various formats compatible with other statistical software. This allows for sharing analyses and further processing in other environments. The specific export options depend on the type of analysis and the target software, but common formats like CSV, TXT, and even specific formats for programs like R or SPSS are often available.
This interoperability enables collaboration and allows researchers to leverage the strengths of different software packages within a single workflow. For instance, a researcher might perform initial data exploration and descriptive statistics in XLSTAT, then export the data and key results to R for more advanced modeling or simulations.
Exporting XLSTAT Results to Other Applications
XLSTAT offers flexible options for exporting results. You can typically export results as tables, charts, or summary reports. Common export formats include CSV (Comma Separated Values), TXT (text files), and potentially more specialized formats depending on the specific analysis performed. These exported files can then be imported into various applications, such as word processors (for report writing), presentation software (for visualizations), or other statistical packages (for further analysis).
The ease of exporting contributes to the efficiency and collaboration aspects of using XLSTAT, allowing researchers to integrate statistical results seamlessly into their overall research process. For example, a summary table of ANOVA results can be easily exported to a Word document to create a professional report.
Future Trends and Developments in XLSTAT
XLSTAT, already a powerful statistical software package, is poised for significant advancements in the coming years. Its future development will likely focus on enhancing user experience, expanding analytical capabilities, and integrating seamlessly with emerging technologies. This will solidify its position as a leading tool for researchers and analysts across diverse fields.
Several key areas present opportunities for improvement and expansion. Increased automation, more intuitive interfaces, and enhanced support for big data analysis are all highly likely areas of focus for future development. Furthermore, strengthening its connections with other popular software platforms will broaden its reach and usability. We can expect to see XLSTAT become even more user-friendly and capable of handling increasingly complex datasets and analytical tasks.
Enhanced Automation and Machine Learning Integration
Future versions of XLSTAT will likely incorporate more advanced automation features. This could involve automating repetitive tasks like data cleaning, preprocessing, and report generation. Integrating more robust machine learning algorithms will also be crucial. Imagine, for example, automatically generating predictive models from your data with just a few clicks, or having the software suggest optimal model parameters based on your dataset.
This will significantly reduce the time and expertise required for complex analyses, making advanced statistical methods accessible to a wider audience. This could include automated feature selection for machine learning models, thereby simplifying the process of model building and improving prediction accuracy.
Improved User Interface and Experience
The user interface is a critical aspect of any software’s success. Future developments in XLSTAT will likely focus on creating a more intuitive and visually appealing interface. This could involve adopting a more modern design, incorporating interactive visualizations, and providing more contextual help and guidance. Think of a drag-and-drop interface for building statistical models, or clear, concise visualizations that instantly communicate complex results.
A more streamlined workflow would make the software more approachable for users with varying levels of statistical expertise.
Expansion of Statistical Methods and Capabilities
The field of statistics is constantly evolving, and XLSTAT must adapt to stay at the forefront. Future updates could include the addition of new statistical methods, particularly in areas like causal inference, Bayesian statistics, and advanced time series analysis. For instance, incorporating Bayesian methods would allow users to incorporate prior knowledge into their analyses, leading to more robust and informative conclusions.
The inclusion of more advanced time series models would enable users to better understand and predict trends in dynamic data, crucial in fields like finance and economics.
Seamless Integration with Cloud Computing and Big Data Technologies
The increasing prevalence of big data necessitates the ability to analyze massive datasets efficiently. Future XLSTAT versions should prioritize seamless integration with cloud computing platforms and big data technologies like Hadoop and Spark. This would allow users to analyze datasets far larger than what is currently feasible, opening up new possibilities for research and analysis. Imagine effortlessly analyzing terabytes of data stored in the cloud, without needing to download or manage it locally.
This would be a significant leap forward in terms of scalability and accessibility.
Predictive Modeling and Advanced Analytics
XLSTAT’s future will involve a stronger focus on predictive modeling and advanced analytics. This includes enhanced capabilities for model selection, evaluation, and deployment. For example, the software could provide automated model comparisons, highlighting the strengths and weaknesses of different models based on specific performance metrics. Furthermore, integrating tools for model deployment and monitoring would allow users to seamlessly transition from analysis to actionable insights.
This could involve directly integrating with business intelligence dashboards or creating automated alerts based on model predictions.
Closing Notes
So there you have it – a deep dive into the world of XLSTAT. We’ve covered everything from its core functionalities to its advanced capabilities, highlighting its versatility and ease of use. No matter your statistical expertise, XLSTAT empowers you to explore data, generate insights, and make data-driven decisions with confidence. From importing your data to creating stunning visualizations, XLSTAT simplifies the entire process, making complex analyses accessible to everyone.
Ready to dive in and unleash the power of XLSTAT on your next project?
Commonly Asked Questions
Is XLSTAT only compatible with Excel?
Primarily, yes. It’s designed as an Excel add-in. However, you can export results to other formats.
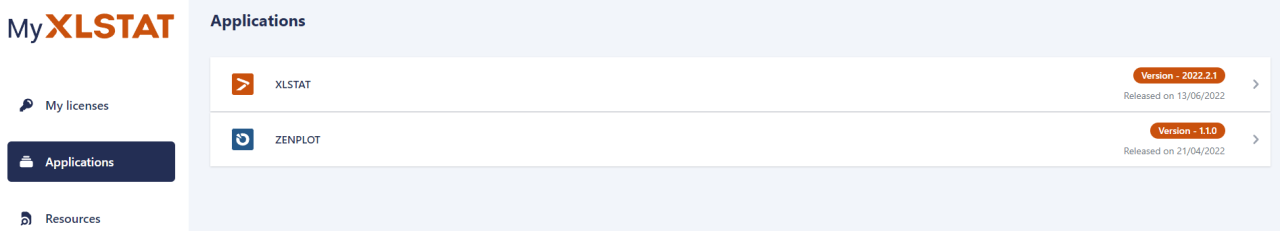
How much does XLSTAT cost?
XLSTAT offers different licensing options, so check their website for current pricing.
What if I need help using a specific function?
XLSTAT has pretty good documentation and online resources, including tutorials and FAQs. You can also contact their support team.
Can XLSTAT handle large datasets?
It can handle sizable datasets, but performance might depend on your computer’s specs. For truly massive datasets, you might consider other specialized software.
Does XLSTAT have a free trial?
Check the XLSTAT website; they often offer free trial periods to let you test the software before committing to a purchase.